Superforecasting

Superforecasting: The Art and Science of Prediction“Beliefs are hypotheses to be tested, not treasures to be protected.” – Philip E. Tetlock and Dan Gardner

Thinking, Fast and Slow is one of my favorite books. In it, Daniel Kahneman details how the human mind works in two modes: one fast and effortless, the other slow and laborious. You engage the slow system to split the check among three friends. The fast system works automatically, filling in blanks and recognizing patterns. It allows us operate smoothly on partial information. However, that quick judgement system can also lead us into dangerous biases and overconfidence.

In Superforecasting: The Art and Science of Prediction, Tetlock and Gardner apply the principles of behavioral economics to the practice of forecasting. Tetlock is the researcher whose previous studies led him to conclude that most expert prognosticators predicted future events no more accurately than dart-throwing chimps.

Tetlock led a major prediction effectiveness study called The Good Judgement Project (GJP). Tetlock and his co-researchers enlisted several thousand volunteers as contestants in a prediction competition. To be statistically meaningful, contestants had to make hundreds of predictions. They were of the sort… Will Scotland vote to secede from the UK? Will the Swiss examination of Yasser Arafat’s exhumed bones find traces of polonium?  

They established a system by which competitors were scored based on a combination of correctness and confidence level. They identified the top 2% as superforecasters. These people consistently predict events with much higher accuracy than everyone else.

You might expect that intelligence is the primary factor that sets the superforecasters apart from the rest, but while they were of above-average intelligence (top 20% of the population), it was the superforcaster’s ability to stay objective, counteract their own biases, and question their own beliefs that make them different and so effective. In large part, they were better at avoiding the biases identified by Kahneman.

From the book, here is a summary of the traits of the superforecasters:

In philosophic outlook, they tend to be:

CAUTIOUS: Nothing is certain
HUMBLE: Reality is infinitely complex
NONDETERMINISTIC: What happens is not meant to be and does not have to happen

In their abilities and thinking styles, they tend to be:

ACTIVELY OPEN-MINDED: Beliefs are hypotheses to be tested, not treasures to be protected
INTELLIGENT AND KNOWLEDGEABLE, WITH A “NEED FOR COGNITION”: Intellectually curious, enjoy puzzles and mental challenges
REFLECTIVE: Introspective and self-critical
NUMERATE: Comfortable with numbers

In their methods of forecasting they tend to be:

PRAGMATIC: Not wedded to any idea or agenda
ANALYTICAL: Capable of stepping back from the tip-of-your-nose perspective and considering other views
DRAGONFLY-EYED: Value diverse views and synthesize them into their own
PROBABILISTIC: Judge using many grades of maybe
THOUGHTFUL UPDATERS: When facts change, they change their minds
GOOD INTUITIVE PSYCHOLOGISTS: Aware of the value of checking thinking for cognitive and emotional biases

In their work ethic, they tend to have:

A GROWTH MINDSET: Believe it’s possible to get better
GRIT: Determined to keep at it however long it takes

To learn what each of these traits mean and how superforecasters manifest them to make significantly better predictions than their peers, check out the book. It’s like Thinking Fast and Slow applied to prediction with a heavy dose of The Black Swan, The Wisdom of Crowds, and Mindset. It was a great read/listen, and I highly recommend it!

The Data-Driven Resume

D3 is amazing. Once I saw a few demos I knew I had to learn it, but what should I build first? It’s always more fun to solve a real problem. It hit me that a truly visual, data-driven resume for developers is way overdue. I’d found my project.

You can see a working demo here and the source here. The rest of this post describes the basics of how it’s put together.

Starting with JSON Resume

I found a promising project called JSON Resume, which made a great starting point for an interactive, data-driven presentation of developer experience. This nifty project defines a standard JSON schema for the contents of a resume. It lets you define the content of your resume as a JSON document, then you can apply any kind of presentation to it. See a nice gallery here.

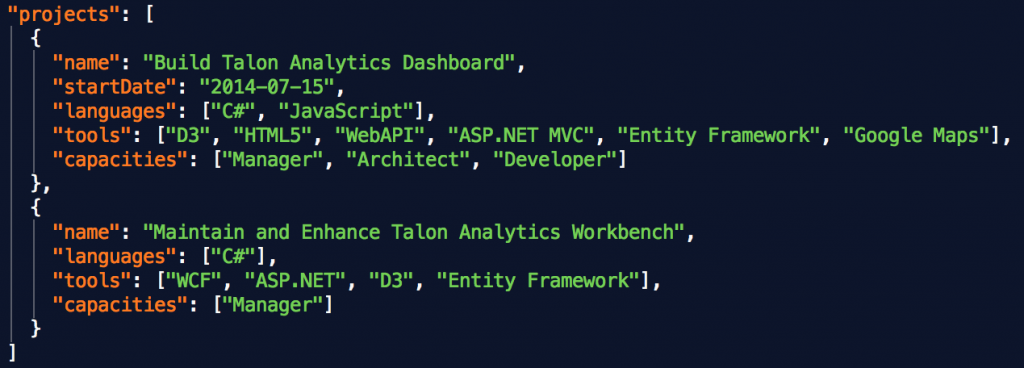
I added a section to each work experience entry for projects. Each project has a name, description, start and end dates, and arrays of roles, languages, and tools. This is the detail that enables all of the visualizations and interaction.

projectJSON

Pick a Theme

I liked the Kwan theme. I converted it from Node and Handlebars to AngularJS. This gave me a good starting point to build around.

Categorizing and Normalizing Project Dates

Before I build any of the charts, I had to iterate through all of the projects, sort chronologically, and allocate timespans to each language and tool. I then build the data structures each of the charts expects.

Roles over Time

Roles

To show the career timeline with the various roles typical developers play, I started with d3-timeline. I had to make only minor tweaks to adapt it from hours to years. These was a nice hover feature that I used to show the relevant project at each time point for each bar.

Area Charts

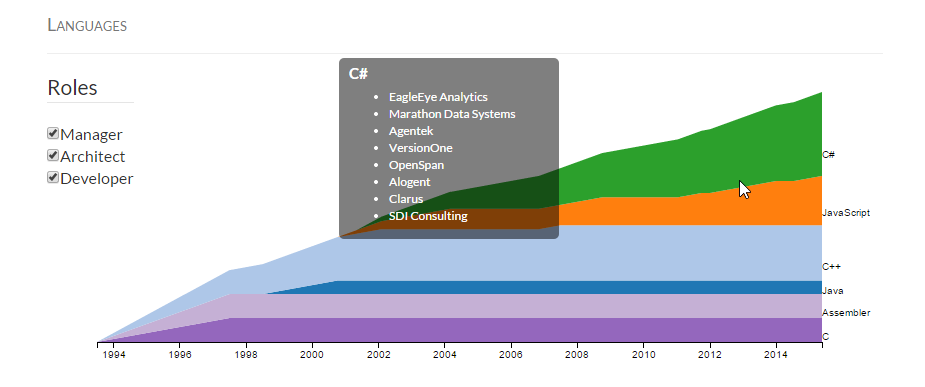
Skills/Languages Area Chart

Skills/Languages Area Chart

An area chart communicates the flow of skills acquisition over time. This shows more than the typical “X years of Y” table and shows how the experience was gained over time. I added filters so you can limit just to particular roles.

Future Enhancements

The layout and graphics could use a designer’s touch. I think libraries should be broken out from tools. We can probably make better use of project descriptions. There is room for enhancing the JSON Resume to describe more detail about the strengths of the developer and the kinds of teams and roles sought. I think this is just scratching the surface of how interactive graphics can tell the story of each developer’s experience and direction.

The code is on GitHub. Try it with your own resume.

Learning Data Science: Brushing Up on Math

CatchingUpOnMathIt doesn’t take a lot of math to understand machine learning, but you will need some calculus and linear algebra. If you haven’t covered these or it’s been long enough that you need to brush up, there are great free options out there.

The excellent Khan Academy covers Linear Algebra, Differential Calculus, and more. Khan is an incredible resource, but if you are intimidated by calculus or just prefer a methodical pace that allows you to develop intuition about the concepts as you go, I highly recommend Jim Fowler’s Calculus 1 Coursera course.

Learning Data Science: Video Courses

You’ve got R and R Studio installed–now what? If you are more of a book-learner, I’ll give you some places to start in the next post, but we’ll start with the MOOC space. There is a lot of new content coming all the time; so all I can give you is a snapshot as of February of 2015, but I’ll provide updates occasionally.

Coursera Data Science Track

Coursera Data Science Specialization

Put together by three professors from the Johns Hopkins University Bioinformatics program, the Data Science Specialization from Coursera is nine 4-week courses on R and Data Science. As of this writing, I’ve taken R Programming, Getting and Cleaning Data, Statistical Inference, and Practical Machine Learning.

Pros:

  • Consistent use of R. You will become pretty proficient with R just by taking a few of these courses.
  • Nice combination of video lectures, quizzes, and practical projects.
  • Popular courses with active discussion groups during class offerings.

Cons:

  • Coverage of topics like statistical inference and machine learning not in-depth enough to be called anything other than surveys.
  • Some of the content and assignments appear to have been rushed and not well edited.
  • The profs don’t interact on the discussion boards.

Machine Learning by Andrew Ng

Machine Learning by Stanford’s Andrew Ng was one of the earliest and most popular courses on machine learning. This course goes into enough depth for you to not just use machine learning as a black box, but to understand how and why it works. That level of understanding comes with a caveat: you’ll need to remember a bit of your college calculus and linear algebra (although Ng provides an optional section on the linear algebra you’ll need).

Statistical Learning

Statistical Learning with Trevor Hastie and Robert Tibshirani is new and in it’s first session. I started the course, but haven’t been able to make the time to keep up with it. However, I think this may be the best course to start with for several reasons:

  • It follows the professors’ excellent text Introduction to Statistical Learning with Applications in R.
  • The lectures are well-produced, featuring a nice combination of seeing the professors and the supporting graphics.
  • Much more in-depth on machine learning than the Data Science Specialization.

Udacity offers some machine courses that look pretty good, but to access the course materials and exercises (which is necessary to really learn), you must use the paid version which is pretty expensive. Also check out Pedro Domingo’s Machine Learning course.

Free eBook on Azure ML and R

Data Science in the Cloud with Azure ML and R is a short eBook that steps you through building a model and deploying it to Azure ML as a Web service. The book assumes you already know how to use R; so, it’s not the best starting point if you are new to R. However, I’d go ahead and pick up the book. It covers the critical area of how to deploy a model once it’s built.

Learning Data Science: Getting Started

Get Started with Data Science on RYou’ve chosen R as your tool for getting started learning data science and machine learning. If you are coming from a background on the Microsoft technology stack, your decision to choose R was affirmed by the recent announcement that Microsoft acquired Revolution Analytics, a leader in the R world.

Download and install R from CRAN, The Comprehensive R Archive Network. You’ll find installers for Mac, Windows, and Linux. I’ve installed on both Mac and Windows. They are both simple and straightforward.

Next, download and install R Studio. Even if you are a command-line person who thinks that IDEs rot the mind and inhibit true learning of a new language, trust me–you will still be writing R code in a Notepad-like experience and the integrated help, plots, and data views make R Studio a must-have. Just like R, R Studio is a a straightforward instal on Mac or Windows.

While you’re at it, download a copy of Introduction to Statistical Learning with Applications in R and The Elements of Statistical Learning. Two of the best data science books on the R platform are made freely available by the authors in electronic format!

Learning Data Science: Choose a Platform


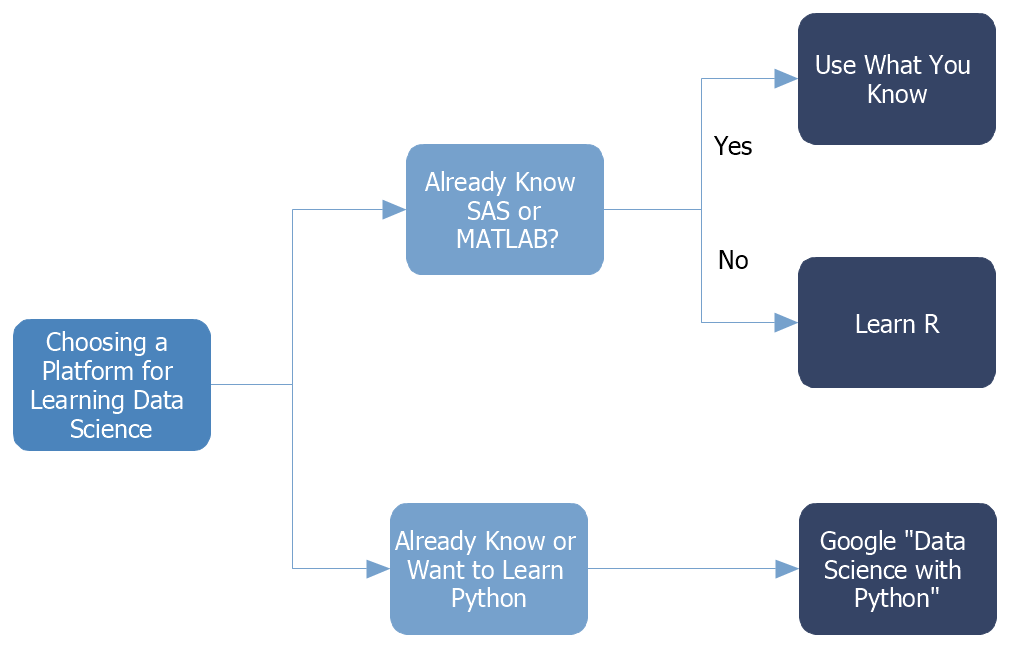
DS-DecisionTree

One of the first questions I confronted when setting out to learn Data Science was what platform to use. As you begin to look at books and courses you realize that you’ll need a basic platform for working with data. Think of it as an IDE for data manipulation, statistics, and algorithms. For example, if you take Andrew Ng‘s popular Machine Learning course, you’ll be doing the exercises in Octave. If you take the machine learning course on Pluralsight, you be using ENCOG.

Data Scientists Love Them Some Python

Python is the most popular general purpose programming language in the machine learning world. I’m not a Python guy (yet), but you can start at SciPy and go from there.

Why I Chose R

I initially started working through Andrew Ng’s course, but I wasn’t sold on spending a lot of time learning Octave. I had a Data Mining book with all the exercises in Weka, but I wasn’t loving that idea either. I kept hearing about this statistics language called R. After some investigation, I found that the R language is nothing to write home about, but R Studio and the vast collection of available packages make R a great choice.

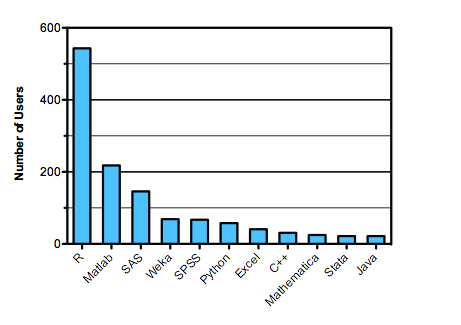
R Studio has been great to work in. The popular Coursera Data Science specialization is essentially an extended course in R. Azure ML Studio now supports the R language. The list goes on and is growing. The folks at Kaggle show the popularity of tools used by their competitors, with R as the clear winner…

Kaggle Tools

Bottom line… if you have an tool that makes sense for you, then use it. Otherwise, start with R.

What is a Data Scientist

Extracting meaning from data is nothing new, but the world has really woken up to the value of predictive analytics and machine learning… preference and recommendation engines, effective marketing, spam filters that actually work, better medicine, even self-driving cars. This new focus has created a scramble as companies have tried to find people with the skills needed to get them into the predictive game. This scramble has led to two problems: 1) what, exactly am I looking for (not just programmers and not statisticians), and 2) where are these people?

Emergence of the Data Scientist

The world has settled on the terms Data Science and Data Scientist. HBR famously referred to the Data Scientist as the sexiest job of the 21st century.

I like the term because its practitioners are applying the scientific method while working in the medium of data–creating and validating hypotheses, making discoveries, and improving life in myriad ways.

A data scientist is more than a statistician:

  • The data is not sitting in nice, neat SAS datasets. It’s in unstructured social media networks, streaming off of sensors, or in various other messy forms.
  • The machine learning algorithms bringing the breakthrough innovations are more computational than mathematical.
  • Implementation of the insights coming from the data require significant programming.

A data scientist is more than a programmer:

  • Programmers don’t normally think in terms of designing and executing experiments.
  • They must understand what data these experiments require and what can be inferred from the data.
  • The big data aspect requires specialized skills in distributed computation.

So, What is a Data Scientist?

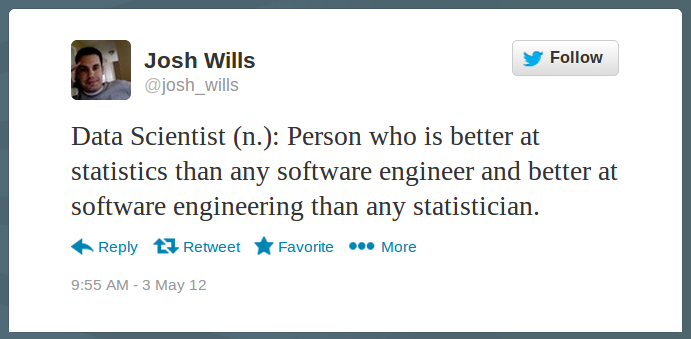
This rare combination of skills–and the hype surrounding the field–has led to some fun definitions of the data scientist:

DataScientistDefinition

These snarky definitions have been pretty popular as well:

  • “Data Scientist is a Data Analyst who lives in California”
  • “A data scientist is a business analyst who lives in New York.”
  • “A data scientist is a statistician who lives in San Francisco.”
  • “Data Science is statistics on a Mac.”

Hype and cynicism aside, the world needs more technologists that can program, handle data, and have a mastery of inferential statistics. There is an incredible need and the work is intellectually stimulating. This has motivated many developers to learn to be data scientists, myself included.

Next up… approaching the data science field as a developer.

An Unexpected Journey

It was just over a year ago when I started talking to small company in Columbia, SC about heading up their Engineering team. They were a .NET shop–right in my wheelhouse. All I had to do was pick up the insurance domain and figure out what predictive analytics and machine learning are all about.

Technically, I didn’t have to understand machine learning because the company has a core research team that develops and maintains algorithms. I would lead the team that turns those algorithms into great software solutions and user experiences for the insurance industry. Of course, no engineer worth his salt is going to be content to treat the heart of his system as a mysterious black box. So, for me, taking the job meant diving into machine learning, which I knew nothing about. As I spent the previous five years building mobile and web field service automation solutions, I knew “big data” was a hot topic, but I had missed the rise to prominence of predictive analytics and the whole Data Scientist craze—the sexiest job of the 21st century

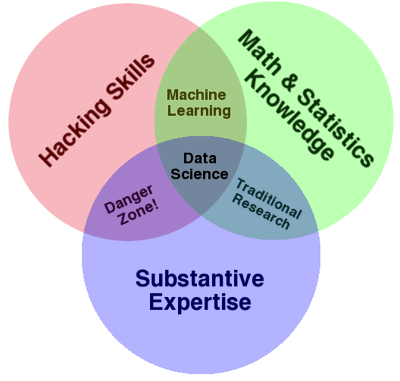
Drew Conway created a helpful and widely referenced venn diagram of skills that define the Data Scientist:

DataScienceVennDiagram

I’ve spent two and half decades filling in the red circle. As a Domain-Driven Design adherent, I’ve always committed myself to learning the domain my software is designed for—in this case insurance. However, I hadn’t given serious thought to higher math and statistics beyond batting averages and occasionally having to remind myself how obscure three sigma outliers are. I enjoyed these subjects in college, but left them behind as i built systems where the most complicated math could be done by a middle schooler. Sure, cryptography has some interesting math, but we rely on libraries for that.

I’m going to use this space to chronicle my journey from a transactional business system developer to a data scientist—or at least a machine learning/predictive analytics specialist. I’m early in the journey, but I’ve made enough missteps as well as positive steps that I can help others looking get into the predictive analytics space.

Turtles All The Way Down

I enjoyed a moment today that would warm the heart of any geeky dad. Sitting in church this morning, the pastor told the story of his college days when he read Chariots of the Gods? and came to believe that life on Earth was seeded by aliens.  As an aside, he added that he hadn’t thought to ask the question of where the aliens came from, and if they came from aliens, then where did those aliens come from. My 11-year-old leaned over and whispered in my ear… “It’s turtles all the way down.”