D3 is amazing. Once I saw a few demos I knew I had to learn it, but what should I build first? It’s always more fun to solve a real problem. It hit me that a truly visual, data-driven resume for developers is way overdue. I’d found my project.
You can see a working demo here and the source here. The rest of this post describes the basics of how it’s put together.
Starting with JSON Resume
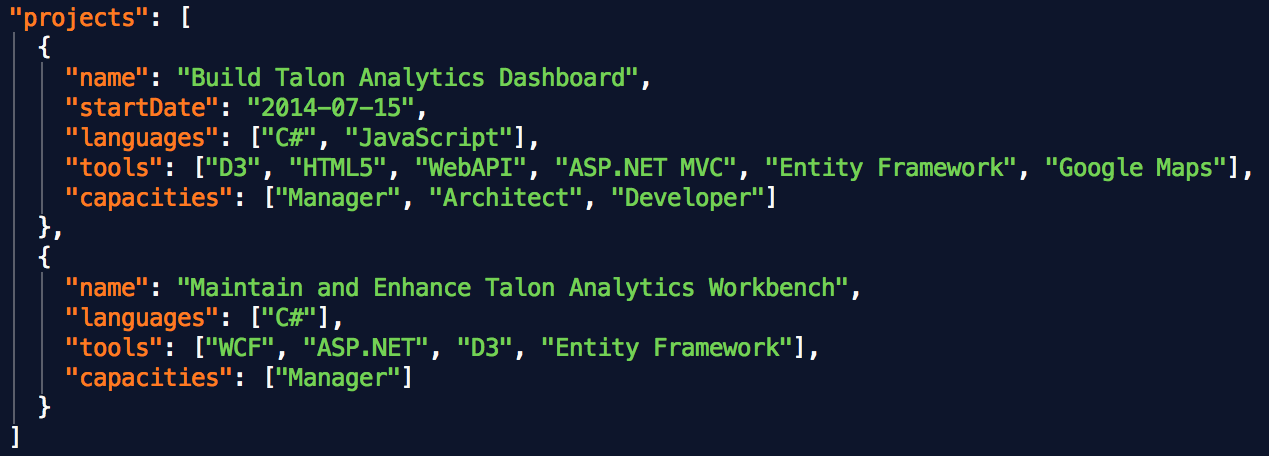
I found a promising project called JSON Resume, which made a great starting point for an interactive, data-driven presentation of developer experience. This nifty project defines a standard JSON schema for the contents of a resume. It lets you define the content of your resume as a JSON document, then you can apply any kind of presentation to it. See a nice gallery here.
I added a section to each work experience entry for projects. Each project has a name, description, start and end dates, and arrays of roles, languages, and tools. This is the detail that enables all of the visualizations and interaction.
Pick a Theme
I liked the Kwan theme. I converted it from Node and Handlebars to AngularJS. This gave me a good starting point to build around.
Categorizing and Normalizing Project Dates
Before I build any of the charts, I had to iterate through all of the projects, sort chronologically, and allocate timespans to each language and tool. I then build the data structures each of the charts expects.
Roles over Time
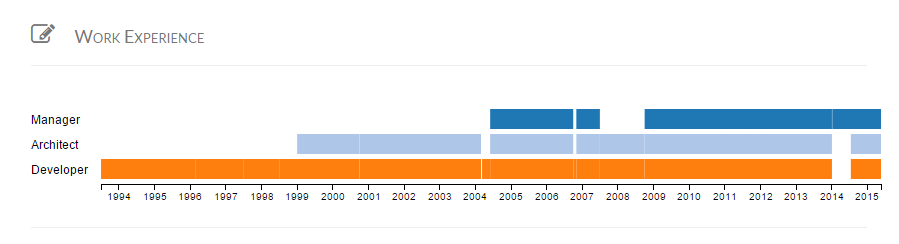
To show the career timeline with the various roles typical developers play, I started with d3-timeline. I had to make only minor tweaks to adapt it from hours to years. These was a nice hover feature that I used to show the relevant project at each time point for each bar.
Area Charts
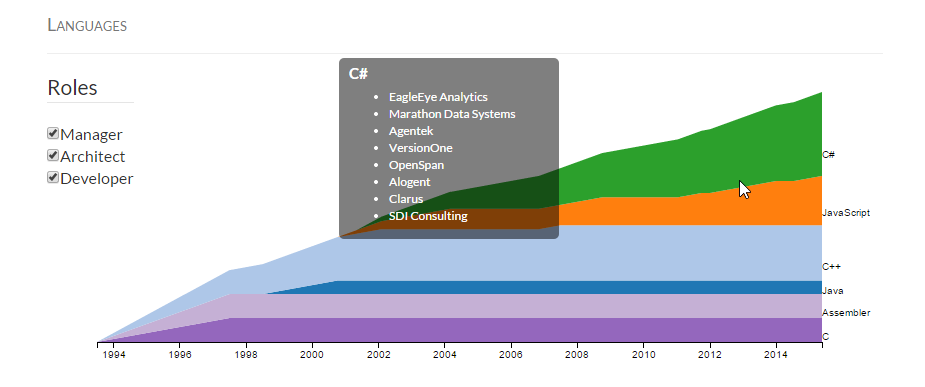
Skills/Languages Area Chart
An area chart communicates the flow of skills acquisition over time. This shows more than the typical “X years of Y” table and shows how the experience was gained over time. I added filters so you can limit just to particular roles.
Future Enhancements
The layout and graphics could use a designer’s touch. I think libraries should be broken out from tools. We can probably make better use of project descriptions. There is room for enhancing the JSON Resume to describe more detail about the strengths of the developer and the kinds of teams and roles sought. I think this is just scratching the surface of how interactive graphics can tell the story of each developer’s experience and direction.
The code is on GitHub. Try it with your own resume.